

Heart rate and other series
GPX files from Garmin, Wahoo, Coros, Suunto, Strava and Apple Watch (through WorkoutGPX) carry more than positions. When a file has them, GPX Explore charts:
| Series | Unit |
|---|---|
| Elevation | m or ft |
| Heart rate | bpm |
| Power | W |
| Cadence | rpm |
| Speed | km/h or mph, from the recorded speed or from the times |
| Temperature | °C or °F |
Switch the chart
Section titled “Switch the chart”The picker beside the chart’s title lists only the series the visible tracks have. Choose one and the chart redraws in its colour, with its average (and for elevation the minimum, maximum and gain) above it. Scrubbing works the same for every series, and the marker on the map follows. GPX Explore remembers the choice and uses it for the next file that has that series.
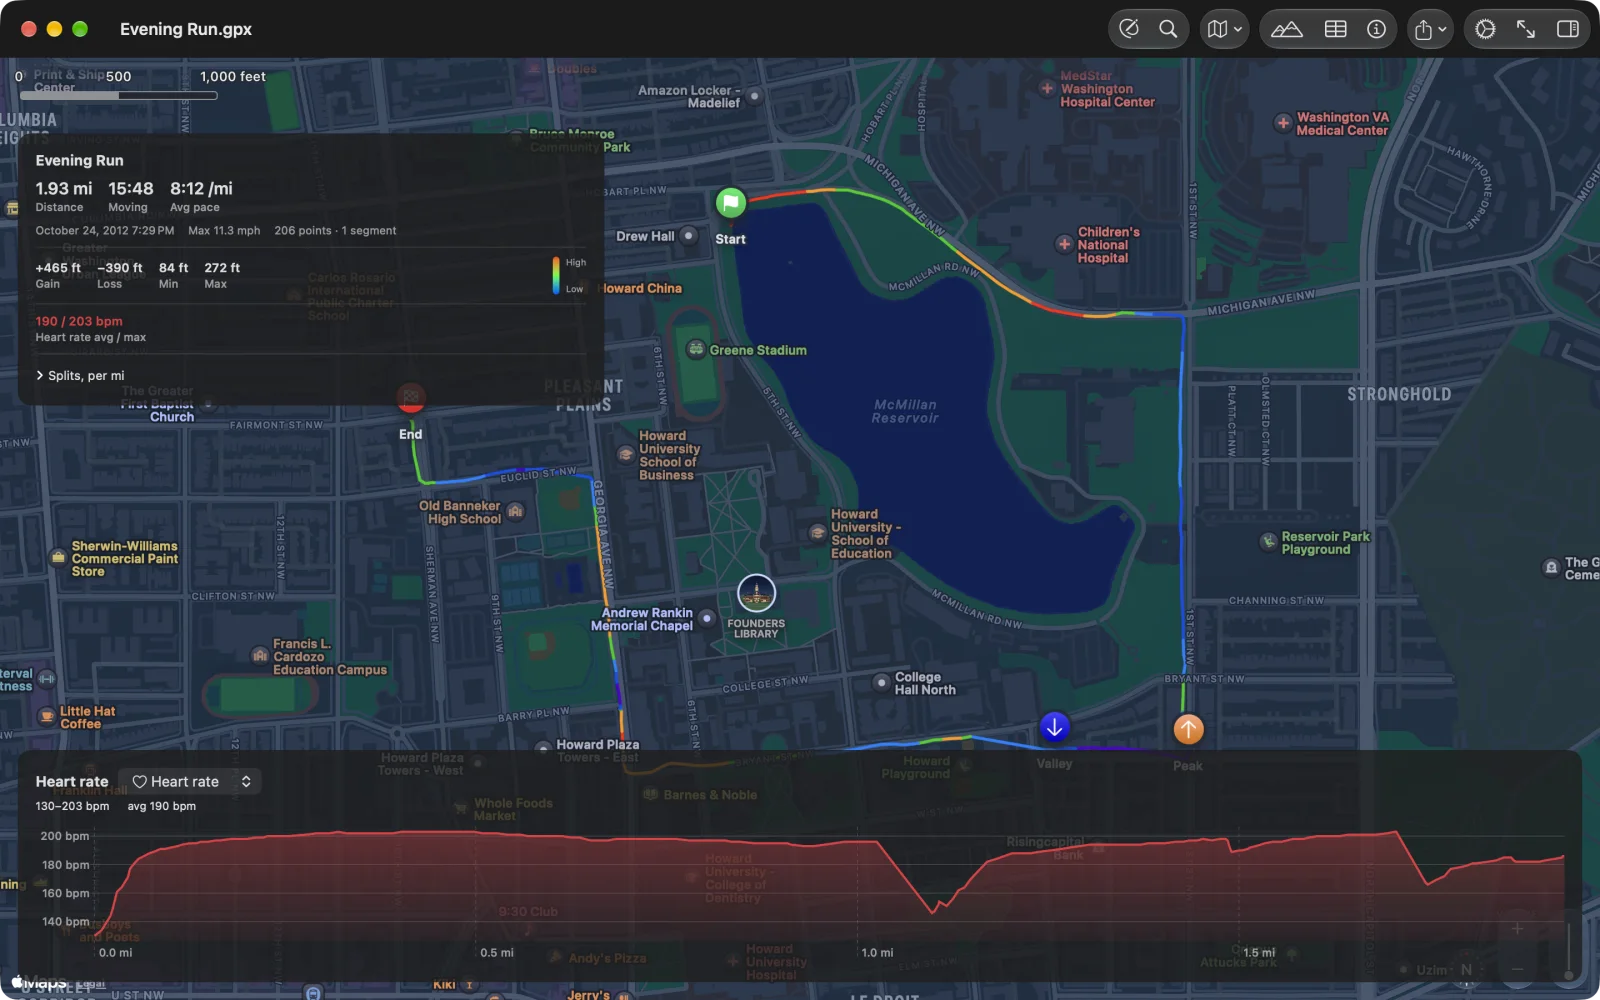
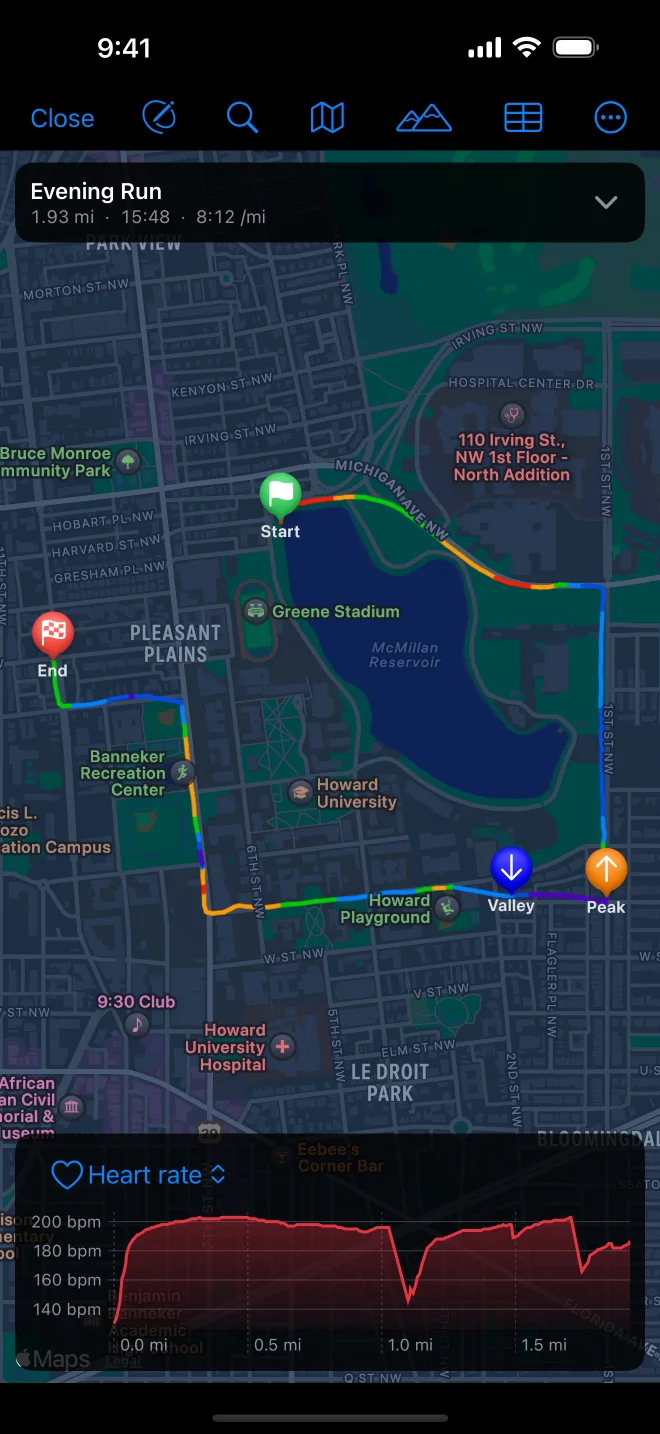
The line on the map keeps its grade or elevation colours whatever the chart shows; the chart is where a series is read, and the marker ties it to the place.
On the route card
Section titled “On the route card”The card lists Heart rate avg / max, Power avg / max, Cadence (the average, leaving out zeros while coasting) and Temperature (the range), each in the colour the chart uses.
In the Points table
Section titled “In the Points table”The Points table has HR, Cadence and Power columns when the track has them, so you can sort to find the highest reading and see exactly where it was.