

The elevation profile
The numbers
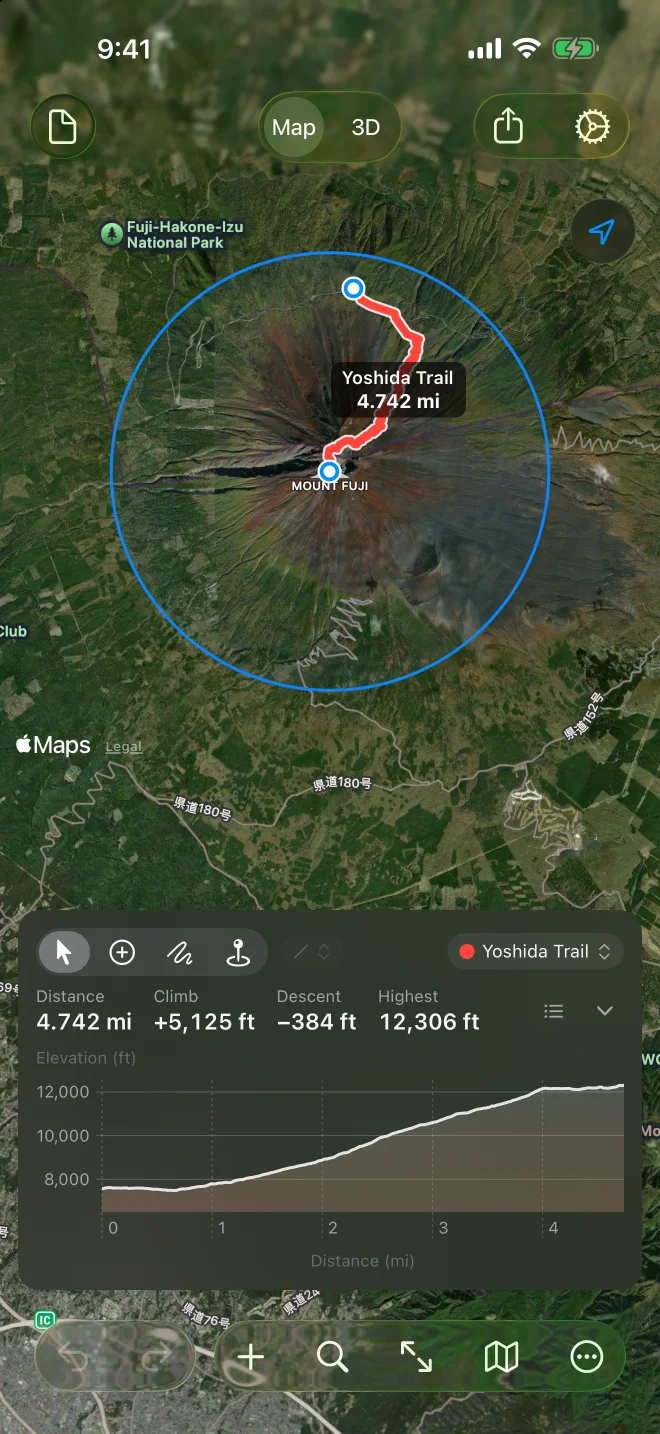
Section titled “The numbers”For a path, the chart (below the map on iPad and Mac, in the card on iPhone) shows:
- Distance, Lowest and Highest point.
- Climb and Descent: the total ascent and descent along the way.
- Avg grade and Steepest: the average grade, and the steepest grade over any 100 metres.
- Vertical: how much the chart stretches the heights to fit, shown as ×N.
On iPhone the card shows the short list (distance, climb, descent, highest); the printed report and the larger chart show everything.
The chart
Section titled “The chart”Height against distance, with sea level drawn as a line and any ground below it in blue. Move along the chart and a ring on the map shows where you are; in 3D, a marker climbs the surface.
Show or hide the chart with View ▸ Chart (⇧⌘C) on the Mac, or Show Chart and Hide Chart in the More menu elsewhere.
How the path is sampled
Section titled “How the path is sampled”The path is sampled every 30 metres, the spacing of the elevation data, with at least 100 and at most a thousand samples. The points you placed are always among them, so the profile passes through every one. Heights are fetched a second after your last change; if Fetch Elevation as You Draw is off in Settings, choose Get Elevation (⌘E).