

Read the ground of an area
An area answers with the ground inside it.
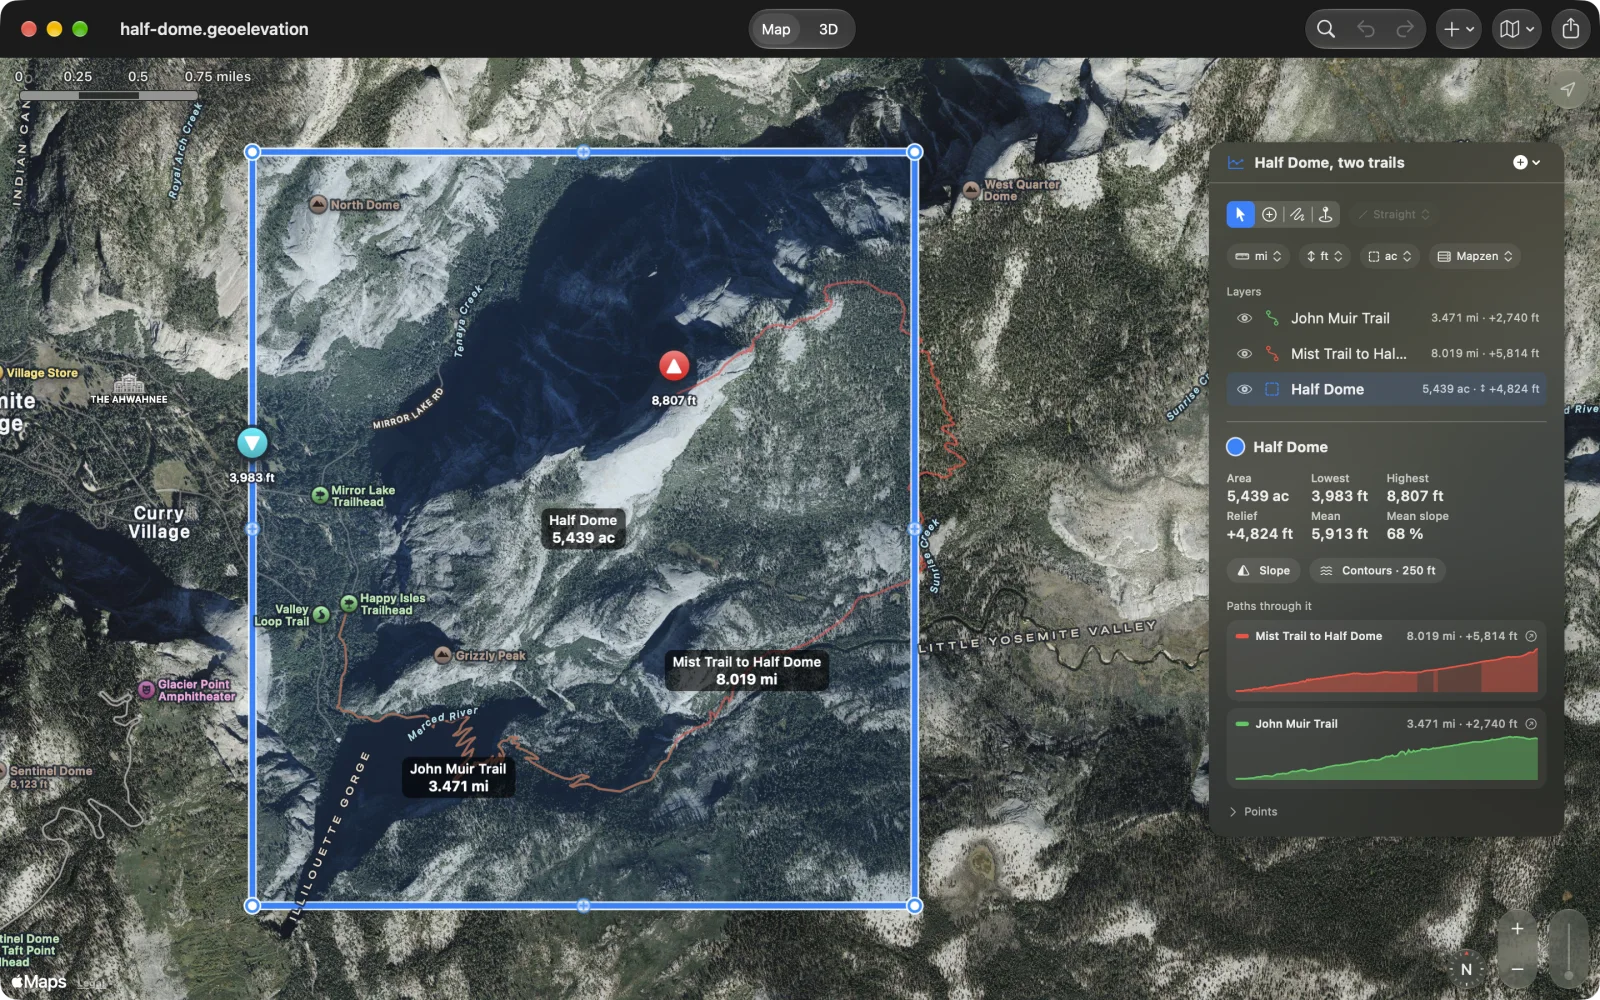
Draw one
Section titled “Draw one”Choose New Area, New Circle or New Rectangle from the + menu (or the Shape menu on the Mac; ⌥⇧⌘N is New Area), then add the corners, or for a circle the centre and a point on the rim. If an outline crosses itself, the map marks the crossing; drag a corner to fix it.
The numbers
Section titled “The numbers”Geo Elevation reads the ground inside the outline every 30 metres. While it does, the panel shows the area and its perimeter (or radius for a circle) and “Reading the ground inside…”. Then it shows:
- Area.
- Lowest, Highest and Mean height, and the Relief between lowest and highest.
- Mean slope.
- The highest and lowest points as markers on the map.
The printed report adds the perimeter and the steepest slope.
Paths through it
Section titled “Paths through it”Every path in the document that crosses the area is listed under Paths through it, each with a small profile. Drag along one, or hover over it on the Mac, and the ring moves along that path on the map. The arrow beside it selects the path.
Slope and contours
Section titled “Slope and contours”The Slope and Contours buttons under the numbers lay the steepness and lines of equal height over the area. See Slope and contours.